Read your dashboard
Know what every part of the dashboard shows, set the period and filters you want, and understand how the main numbers are counted.
The Dashboard is the first screen you see after signing in. The top shows your numbers for a period you choose. Below that are charts, a leaderboard, this week's calls and five work lists with the things that need attention today.
Sales Reps, Setters and Triagers see their own records only. Owners, Sales Managers and Analysts see the whole team and can narrow the dashboard to one or more people with the All Team Members selector next to the title.
What is on the dashboard
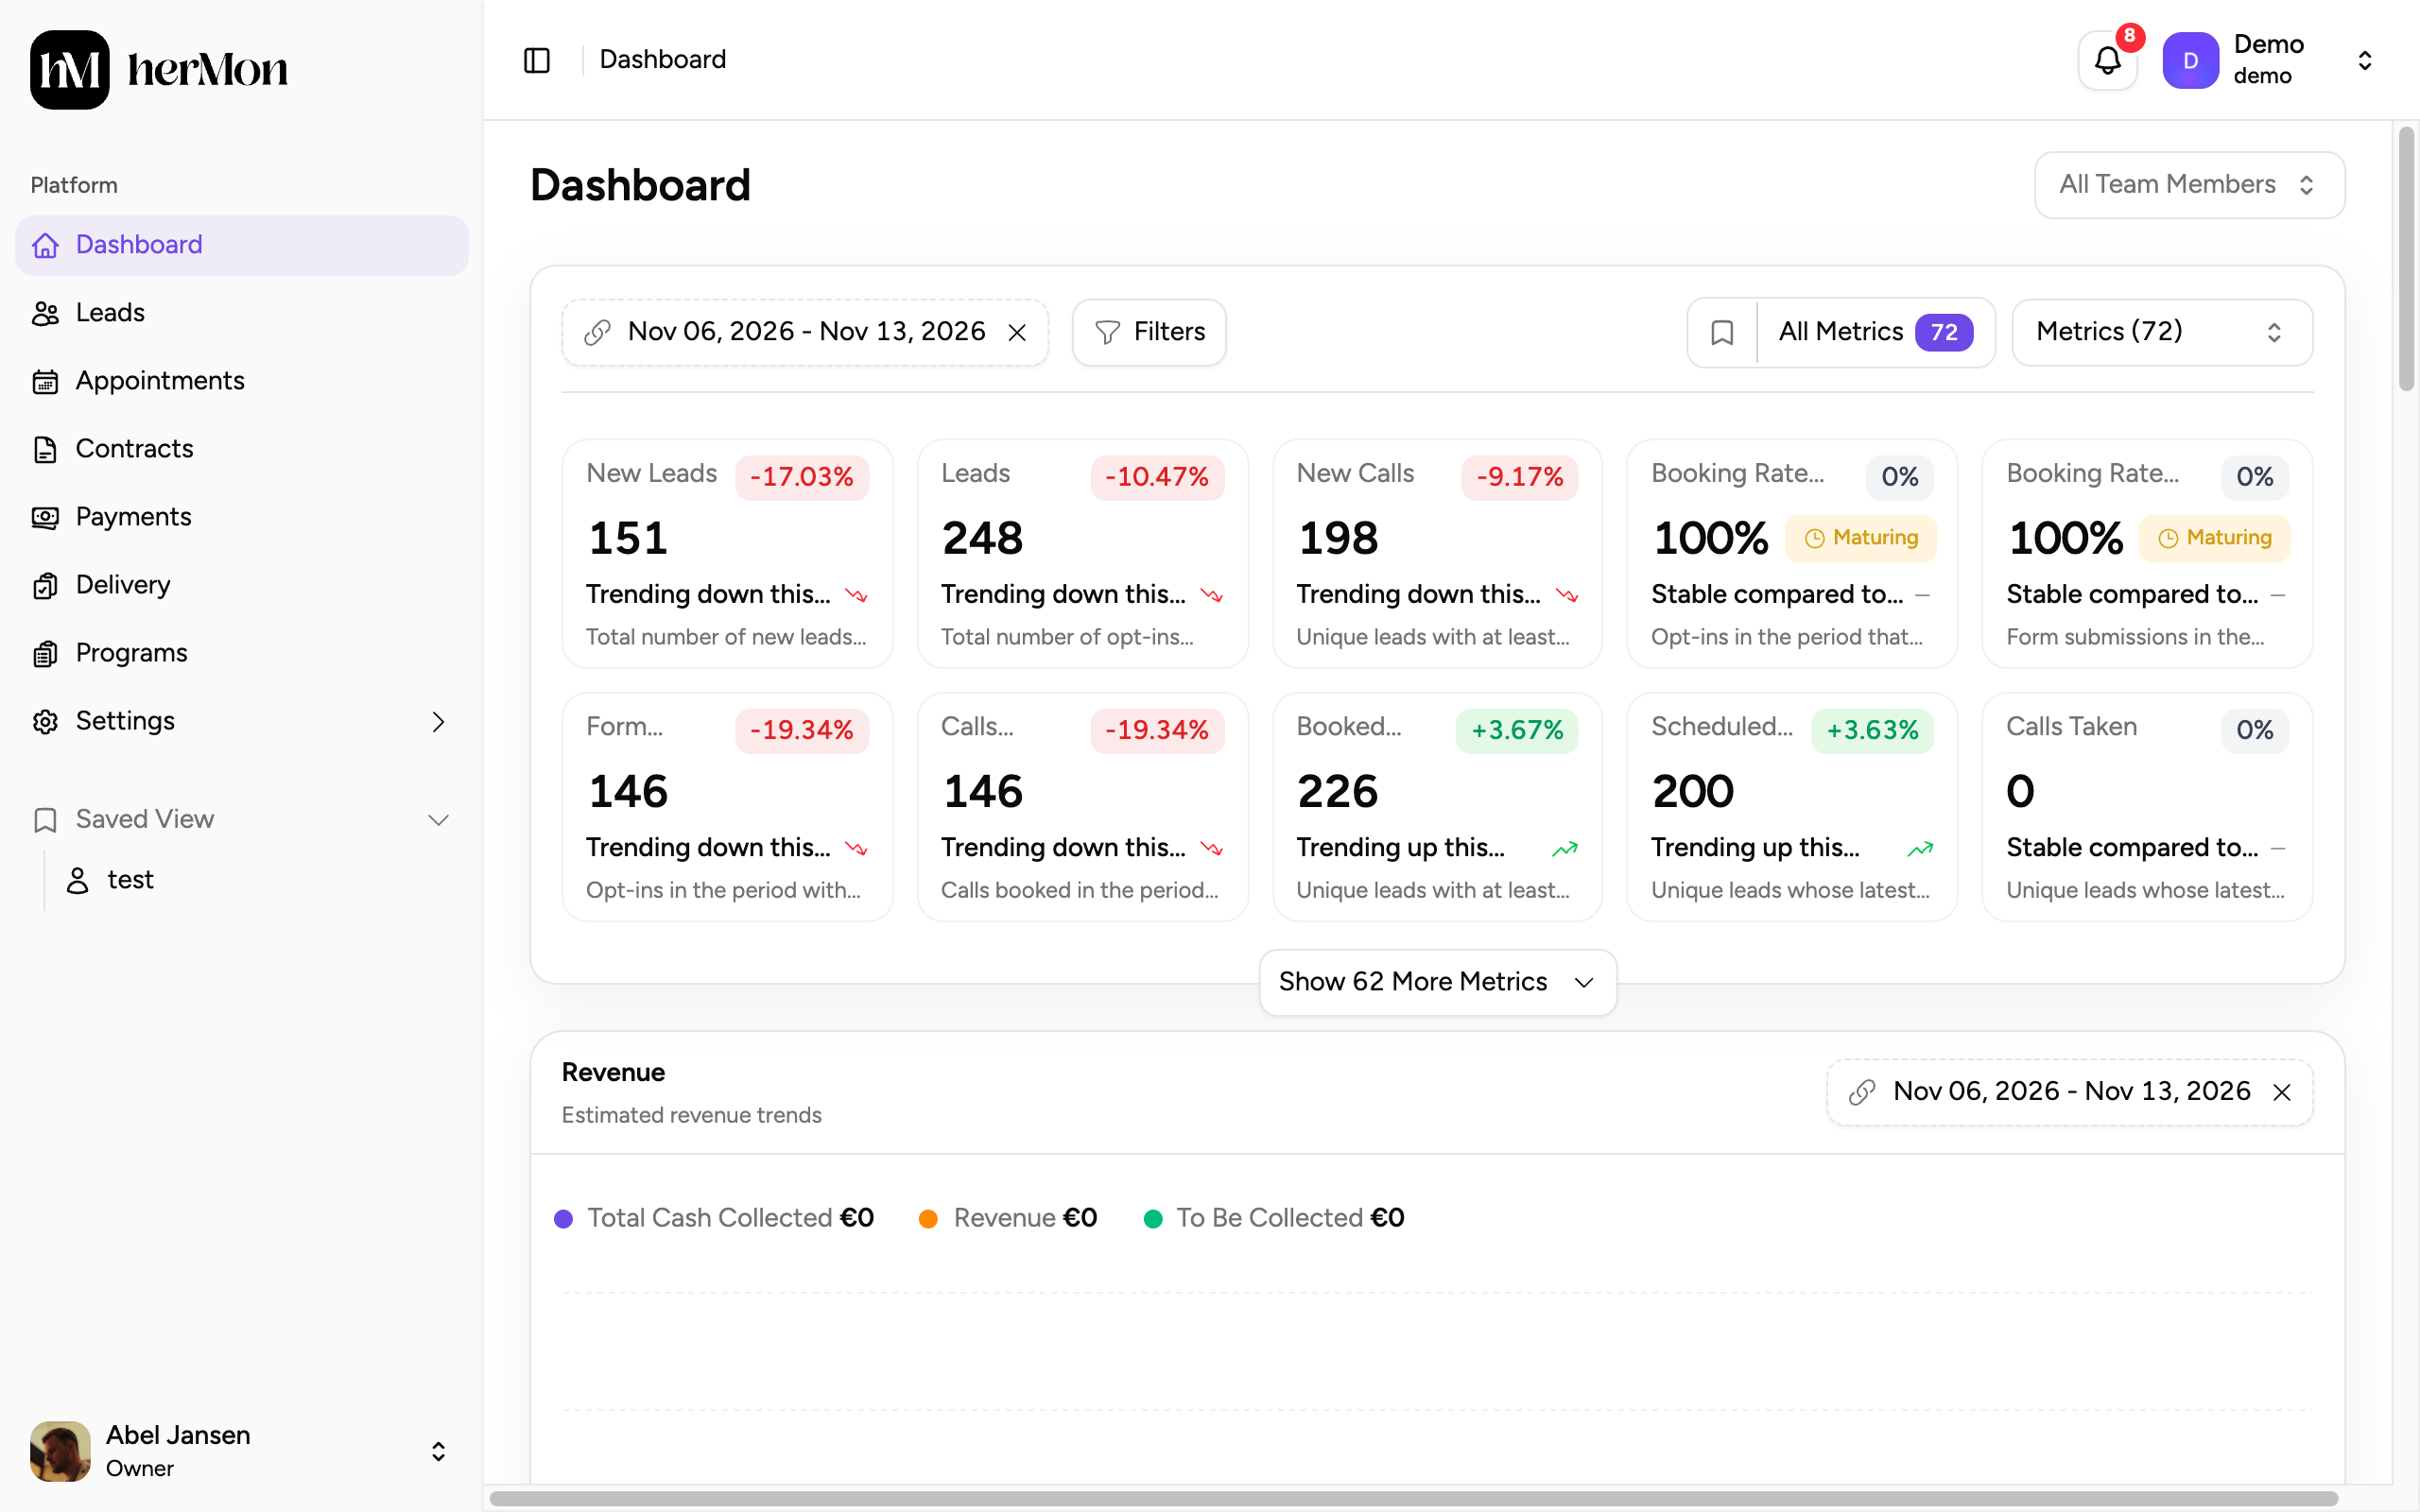
| Part | What it shows |
|---|---|
| Metric tiles | One number per tile for the chosen period, with the change against the previous period. Click a tile for a chart and the records behind the number. |
| Revenue | Cash collected, revenue and money still to be collected, plotted by date. |
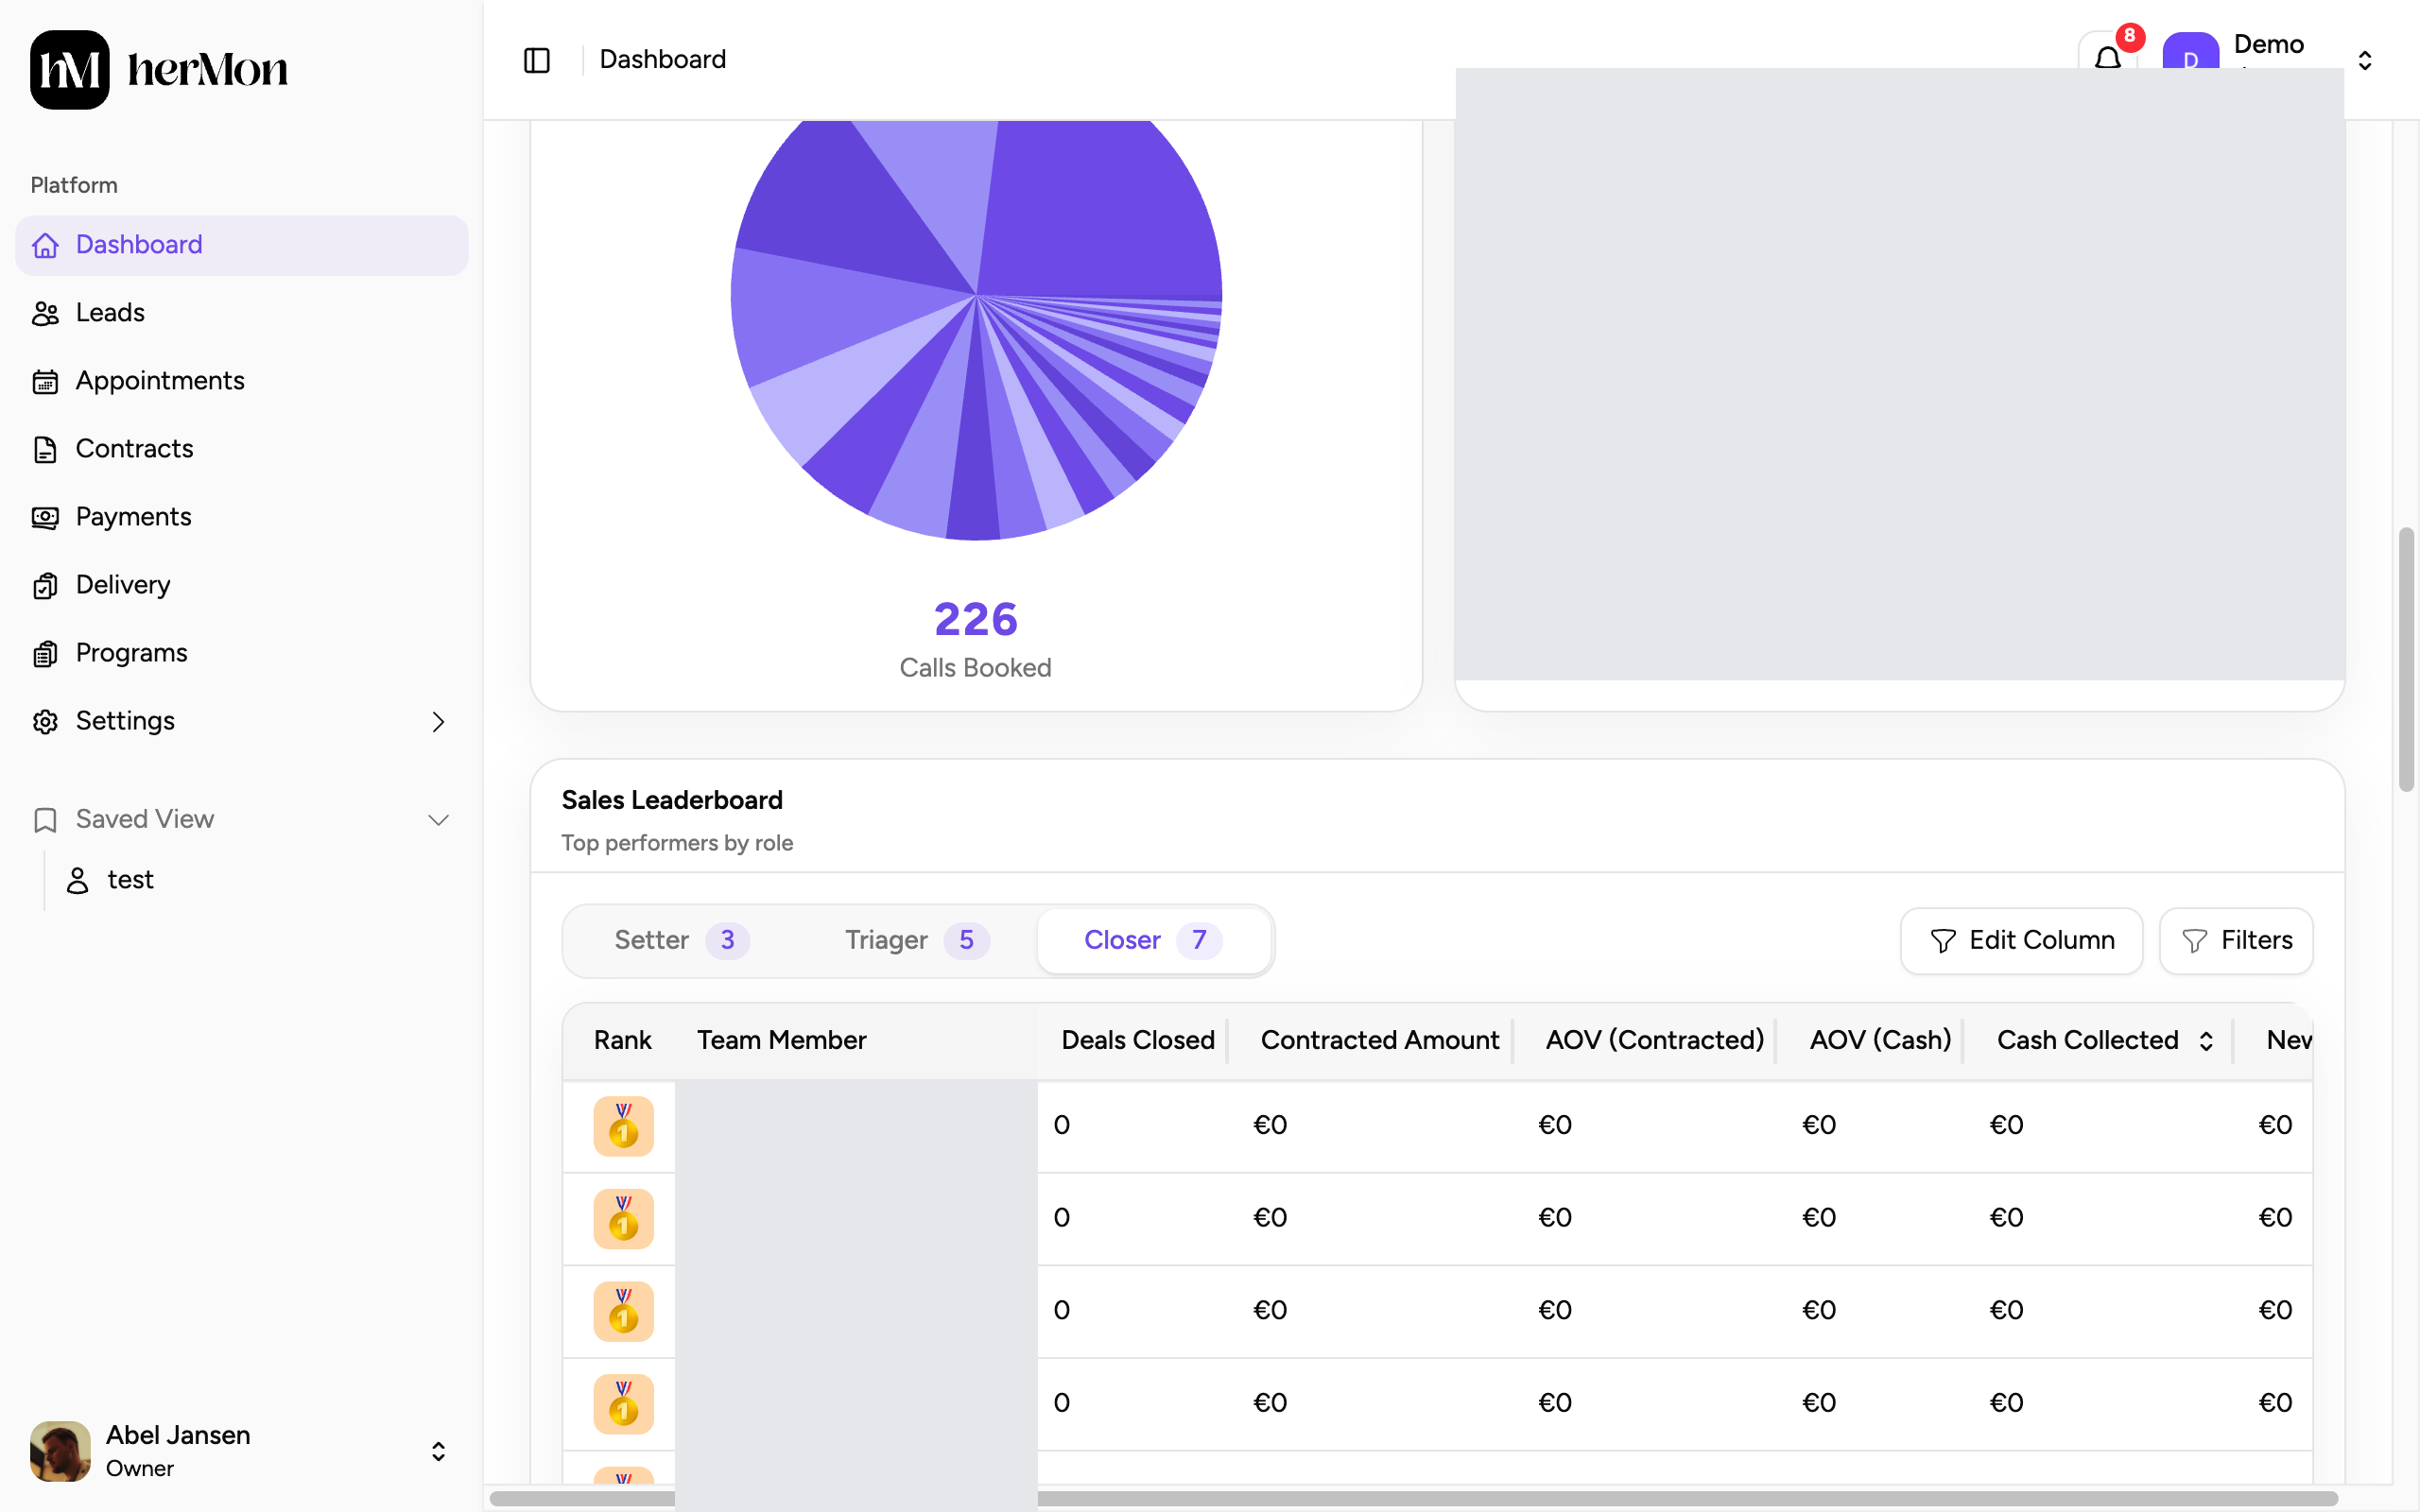
| Call Distribution By Call | A pie chart of your calls. Use its own Filters button to change the grouping, call category and metric. |
| Sales Leaderboard | Team members ranked per role, with tabs for setter, triager and closer and a Metrics selector for the columns. |
| Top Performing Campaigns | Your Meta campaigns, ad sets and ads, ranked. Needs Meta connected. |
| Appointments Schedule | This week's calls. Click a call to open it. |
| Work lists | Five tabs with what needs action. See below. |
Which of these blocks you see depends on your role. An Owner can hide a block for a role in the organization settings.
Set the period and filters
Choose the period
Click the date button at the top left of the metric tiles. Pick Today, Yesterday, This Week, This Month, This Year, Specific Day or Custom.
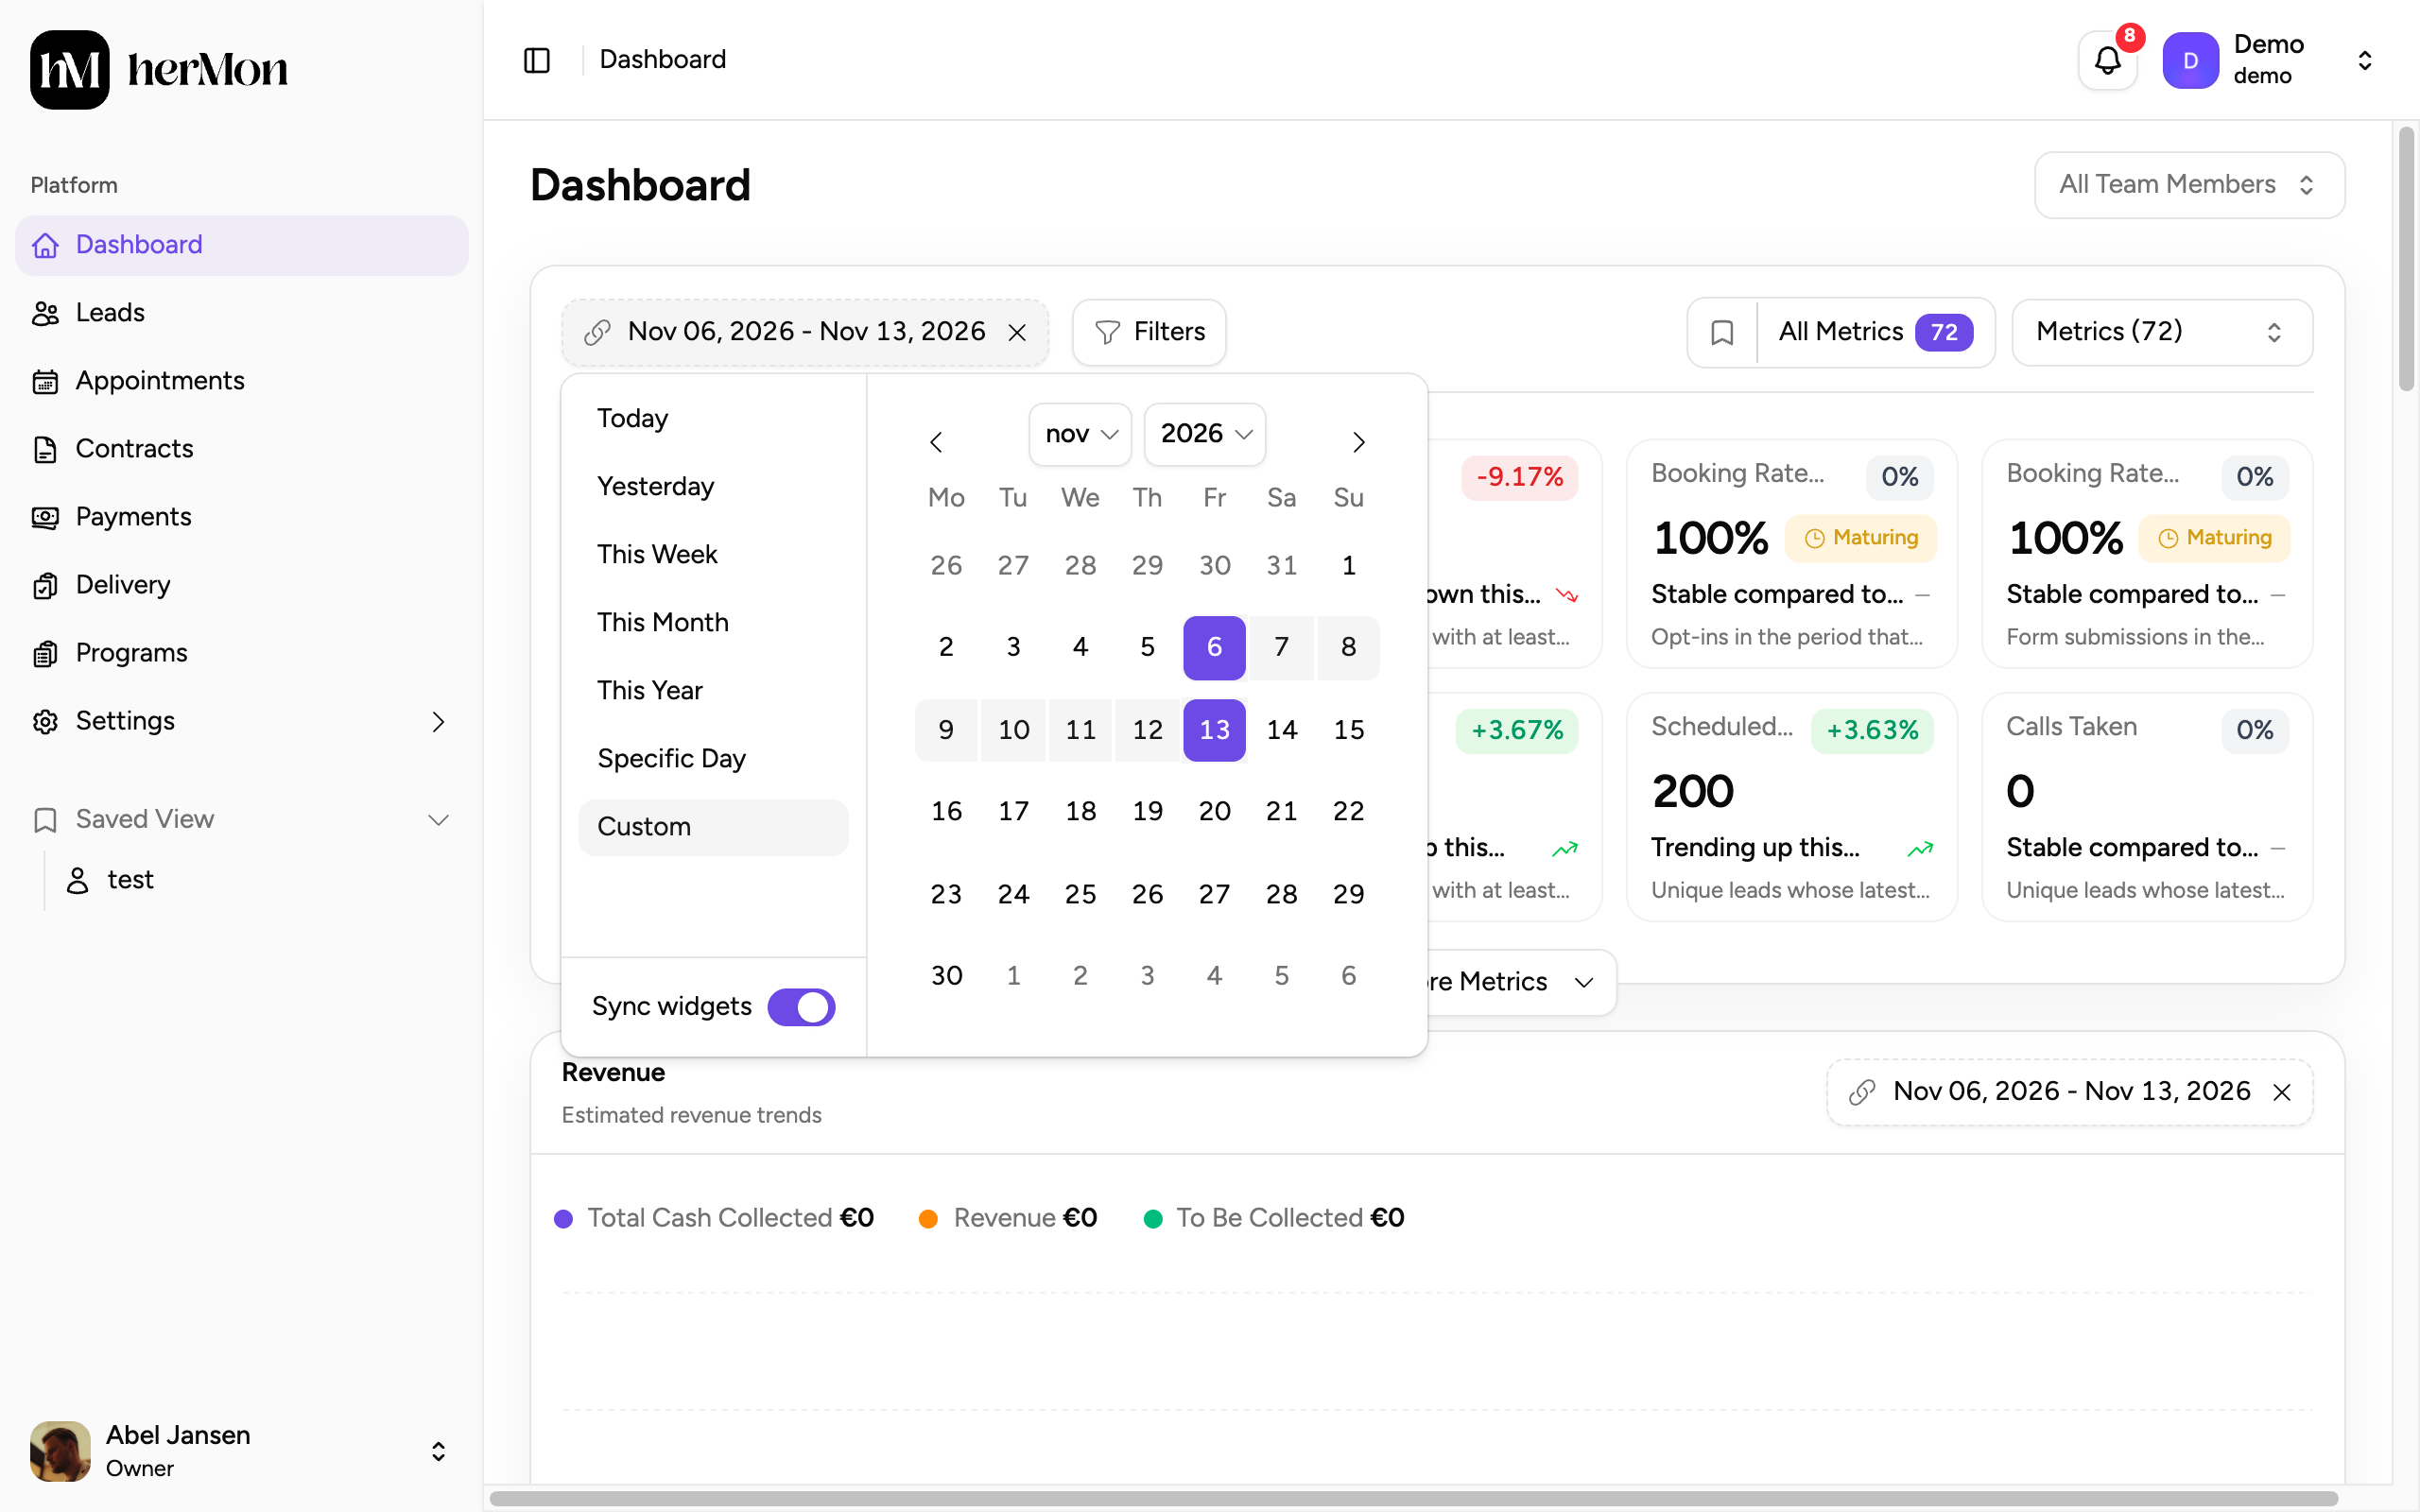
1. A preset period. 2. Sync widgets. Decide if the charts follow
With Sync widgets on, the revenue chart, leaderboard and other blocks use the same period. Turn it off to give each block its own date range.
Narrow the numbers
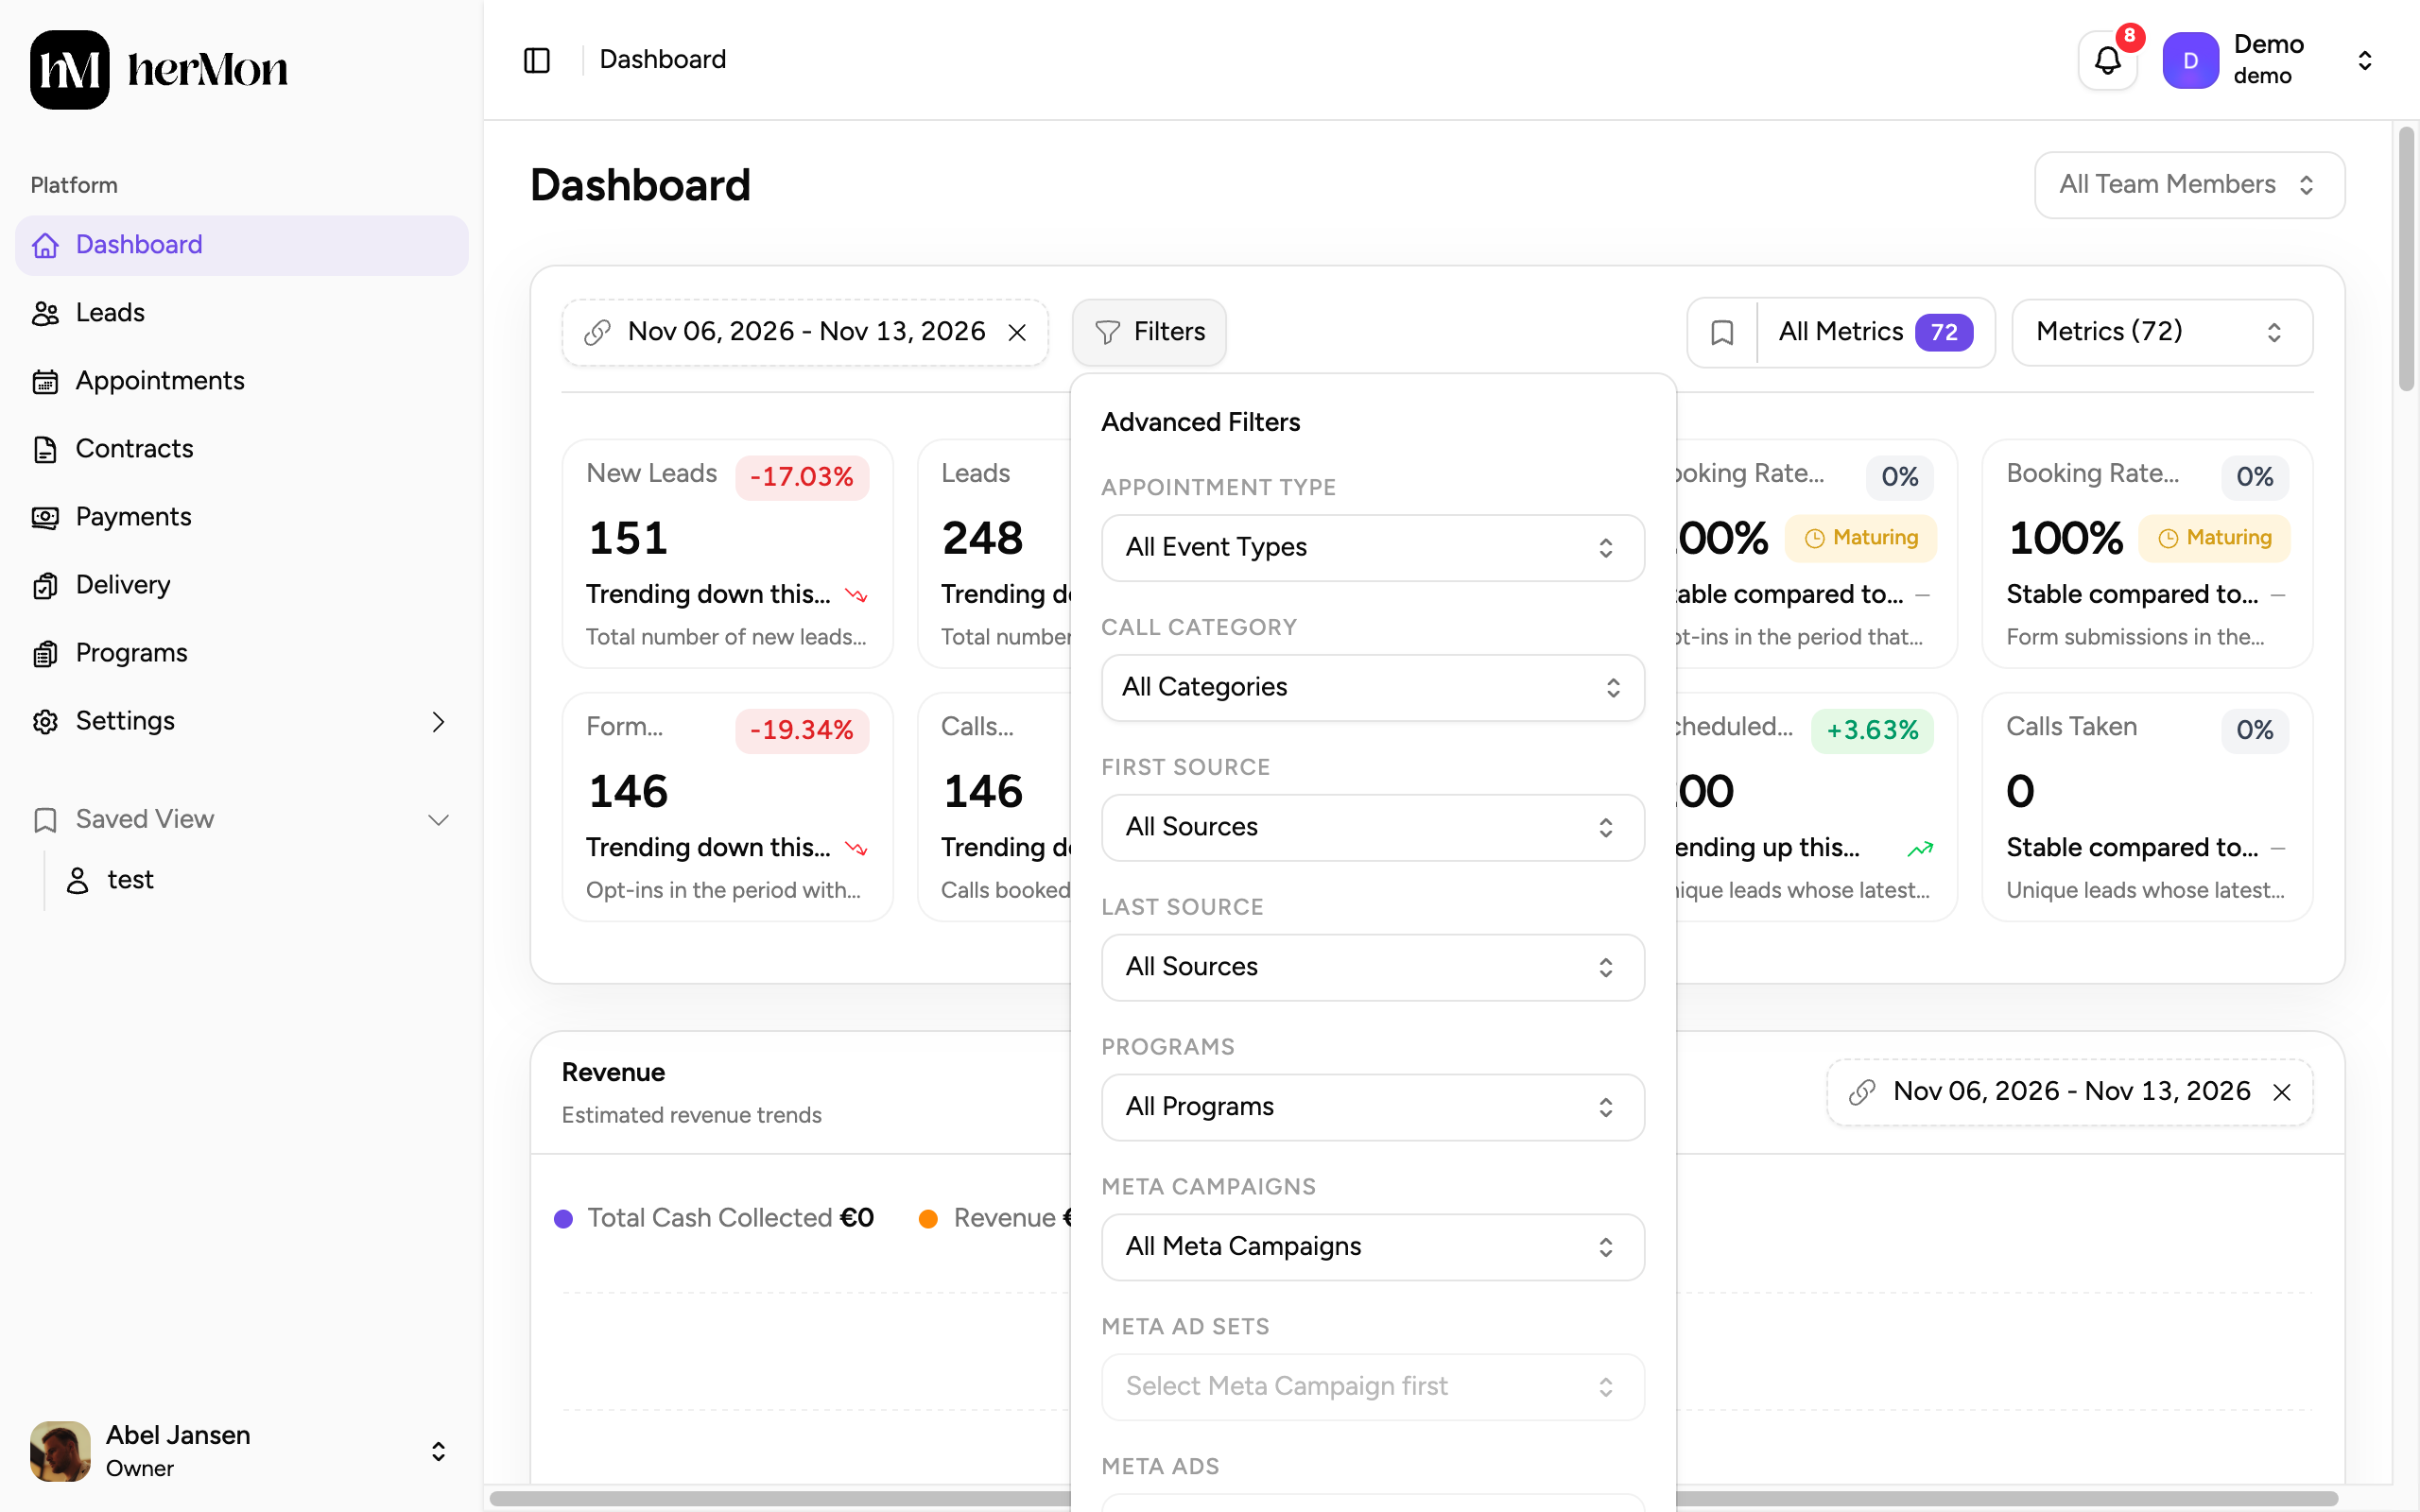
Click Filters to limit the tiles by Appointment Type, Call Category, First Source, Last Source, Programs or Lead Status. The badge on the button shows how many filters are active. Clear all removes them.
Pick your metrics
Open Metrics at the top right and tick the tiles you want. Drag a tile to change the order. When there are more than ten tiles, click the Show More Metrics button below them to see the rest.
Save it as a view
Open the view selector next to Metrics (it reads All Metrics until you pick a view) and choose New view. A view remembers the period, filters, metrics and their order. You can set one as your default.
The work lists
The tabs at the bottom show a count when there is something to do.
| Tab | What is in it | What to do |
|---|---|---|
| Today's Appointments | Calls scheduled for today | Click a row to open the call, or click the outcome to log it |
| Follow-ups | Leads with a next touch point that is due, with a count of overdue ones | Tick Mark as done, or move the touch point |
| Payments at Risk | Failed, overdue and upcoming payments | Click a row to open the payment |
| Awaiting Signature | Contracts that were sent and not signed yet | Click a row to open the contract |
| Missing Outcomes | Past calls without an outcome | Click the outcome to log it |
Keep Missing Outcomes empty. A call without an outcome is not counted as taken, so it lowers your show rate and close rate. See Manage appointments and log call outcomes.
How the numbers are counted
The dashboard counts leads, not appointments. A lead with three calls in the period counts once, judged by the most recent call. Coaching calls are never counted. This is the most common reason the dashboard differs from an export.
| Metric | In plain words |
|---|---|
| New Leads | Leads created in the period |
| Booked Calls | Leads with a sales or triage call scheduled in the period, whatever the outcome |
| Scheduled Calls | Booked calls that were not cancelled or rescheduled |
| Calls Taken | Past calls with a completed outcome: won, deposit or one of the no-sale outcomes |
| Show Rate (Scheduled) | Calls taken as a share of scheduled calls that are already in the past |
| Show Rate (Booked) | The same, against booked calls, so cancellations count against you |
| Close Rate (Taken / Scheduled / Booked) | Of the calls in the period, the share that led to a signed contract, also when the contract was signed later |
| Booking Rate | Of the opt-ins in the period, the share that booked a call, whenever that call was booked |
| Contracts Signed | Contracts signed in the period |
| Cash Collected | Payments paid in the period, minus refunds on those payments |
| New Cash Collected | Only deposits and first payments, minus refunds. Instalments and subscription cycles are left out. |
Good to know
Which period does a record fall in? Calls count on their scheduled date, contracts on the signing date, payments on the paid date and leads on the day they were created.
Close rate follows the call, not the signature. A deal signed this week for a call taken last week counts in last week's close rate. Dividing signed contracts by calls taken from an export will not give the same number.
A blank rate is not zero. A rate stays empty when there is nothing to measure, for example no calls in the period.
Renamed outcomes keep working. Each outcome has a type behind it, such as won, no-sale or no-show. The dashboard counts by type, so you can name your outcomes as you like.
Sales made through an Offer Link count in Cash Collected only. They are not in Contracts Signed or the close rates.